Life for 5,000 Households Across the Northern Triangle
In 2019-2020, the World Food Programme (WFP) collected data about households in the Northern Triangle , across El Salvador, Guatemala, and Honduras. While migration may be perceived as an individual endeavor,the reality is of course that migration is often vital for survival of entire families. Migration affects entire households. Here, we have visualized almost 5,000 households , encompassing over 20,000 individuals .
We can begin asking questions such as:
+ What is the link between migration and household size?
+ How does migration affect education within families?
+ How does migration affect income sufficiency ?
An Almost Even Distribution Across Guatemala, Honduras, and El Salvador
Households are located all across the Northern Triangle. In relation to our data, 34.6% live in Guatemala, 31.4% live in Honduras, and 34% live in El Salvador. Within these countries, households are located across urban and rural areas, with 68% living in rural areas and 32% living in urban areas.
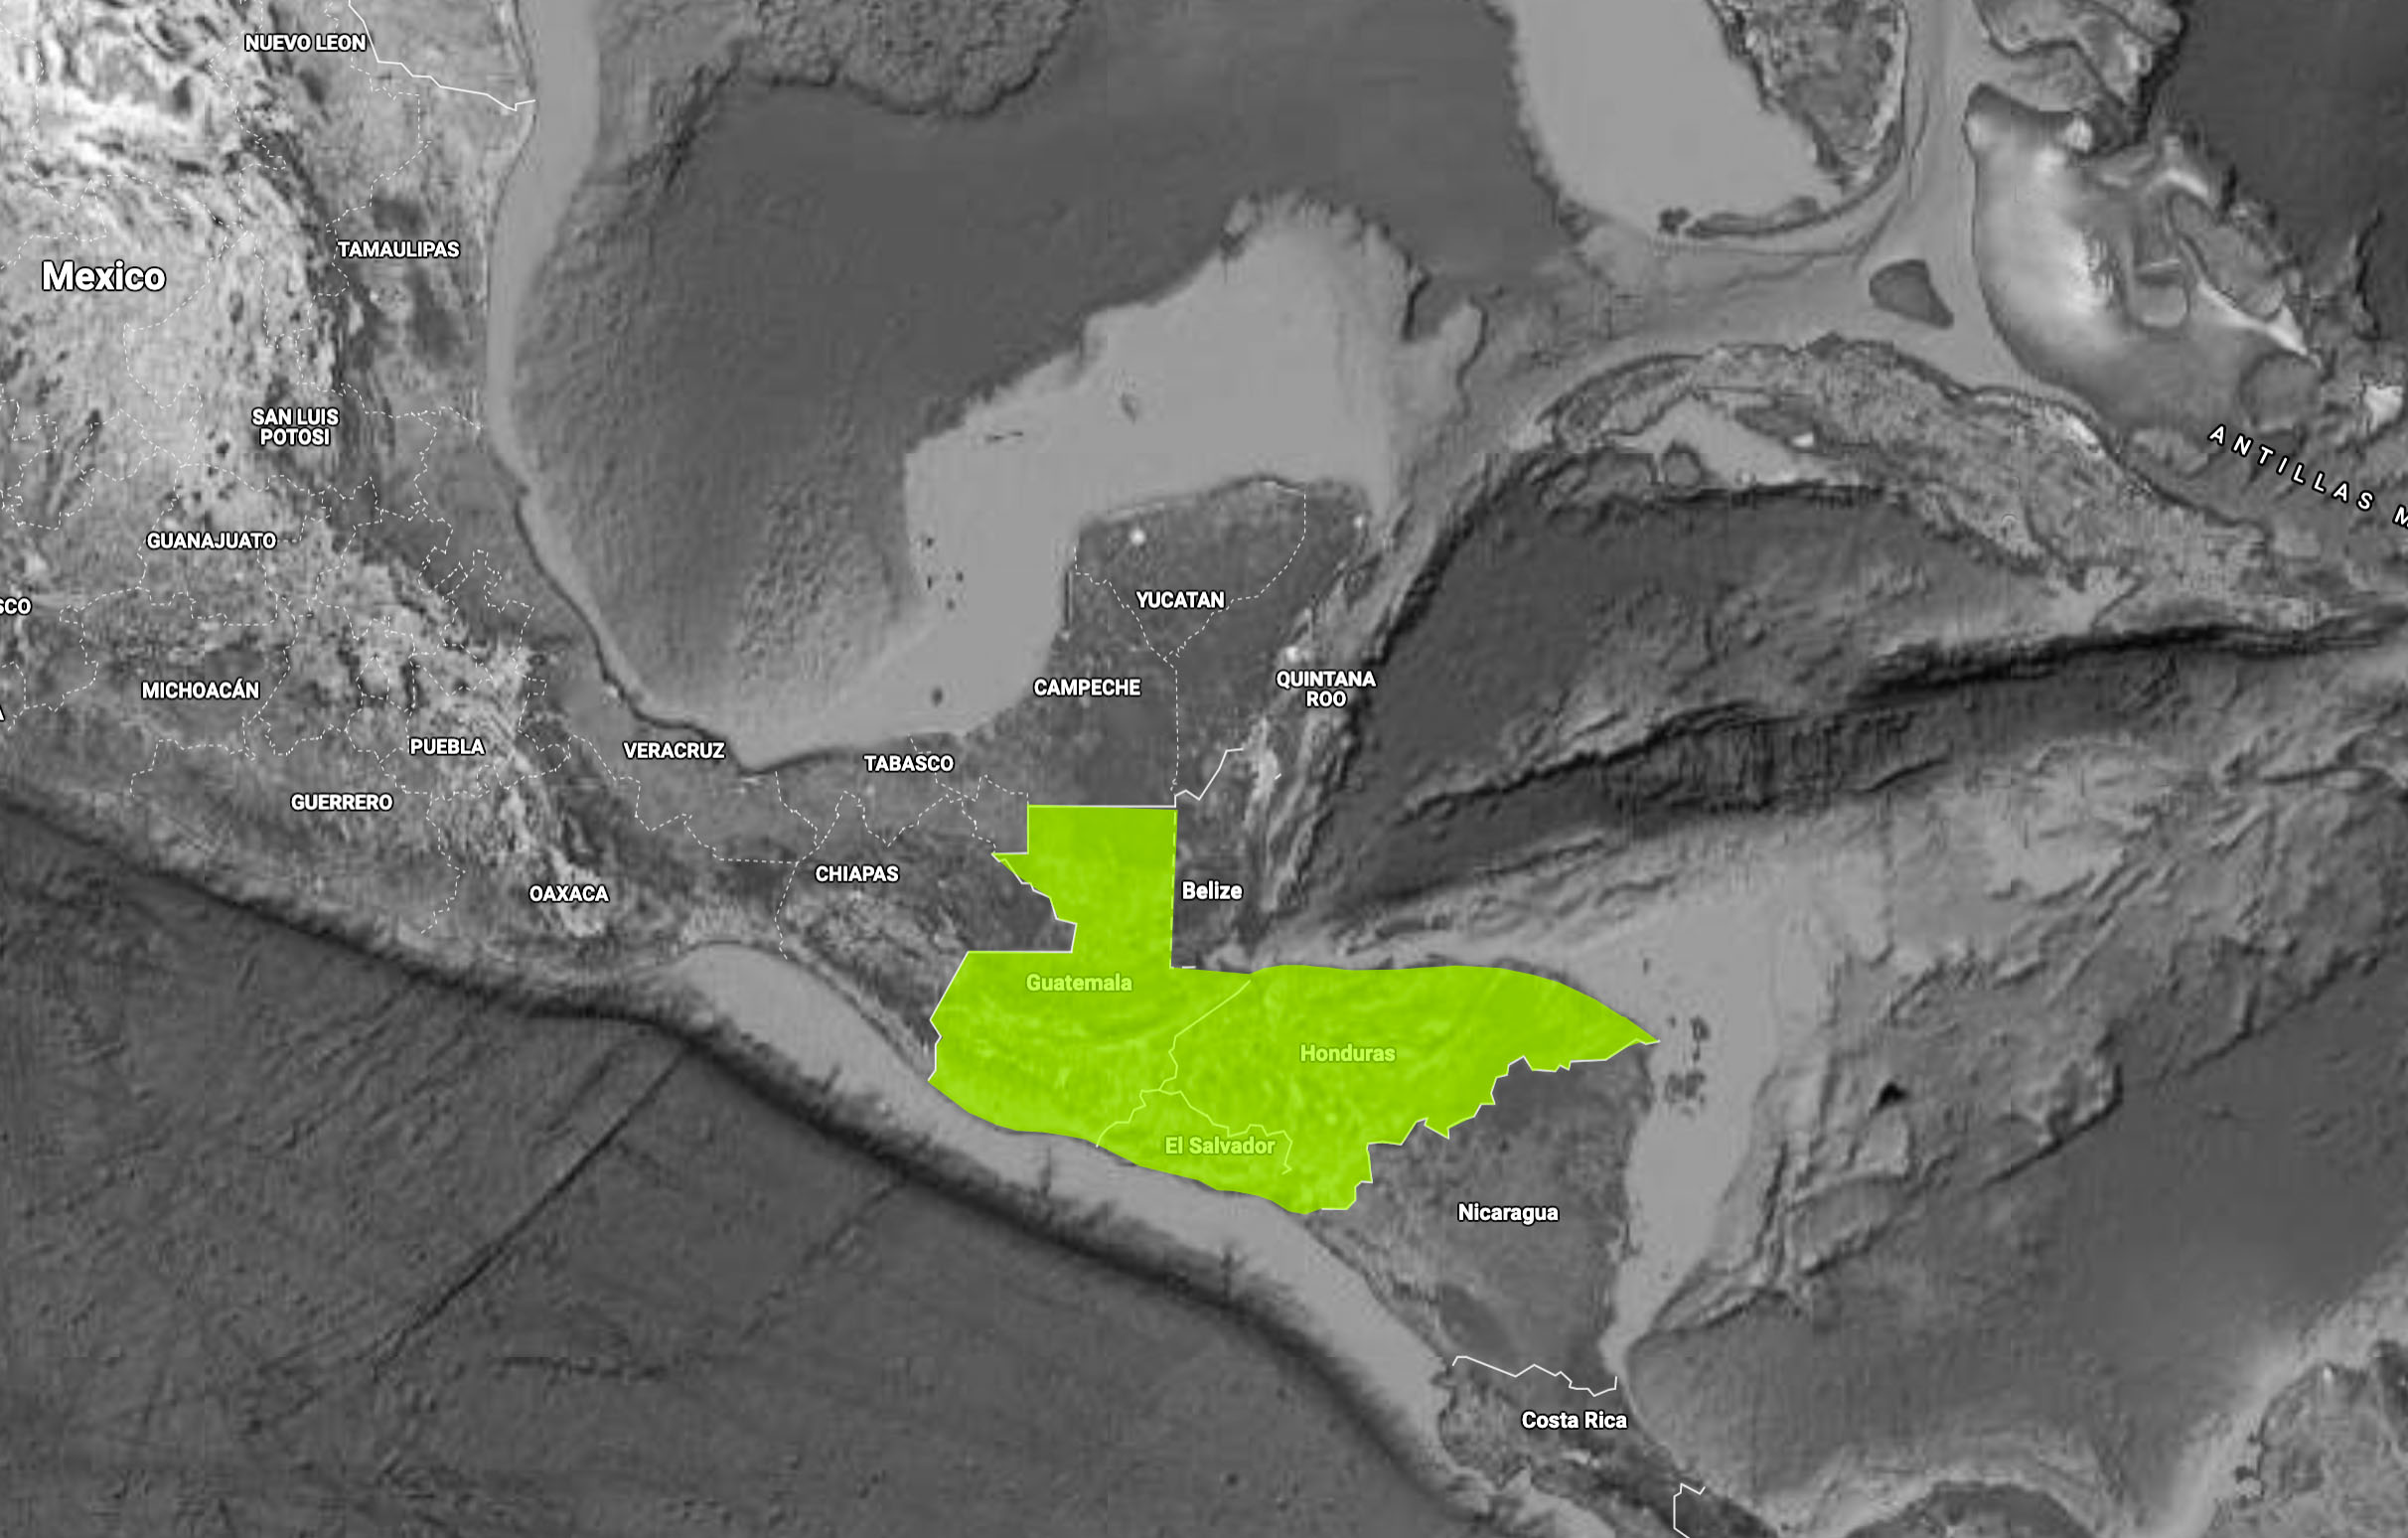
Map of the Northern Triangle
Migration Remains the Minority
Migration in our dataset is certainly an anomaly, not the norm. Here, we can see that over 76 percent of households do not have any migrants in their family in the last five years. In contrast, only 24 percent of households have at least one family member that has migrated externally in the last five years.
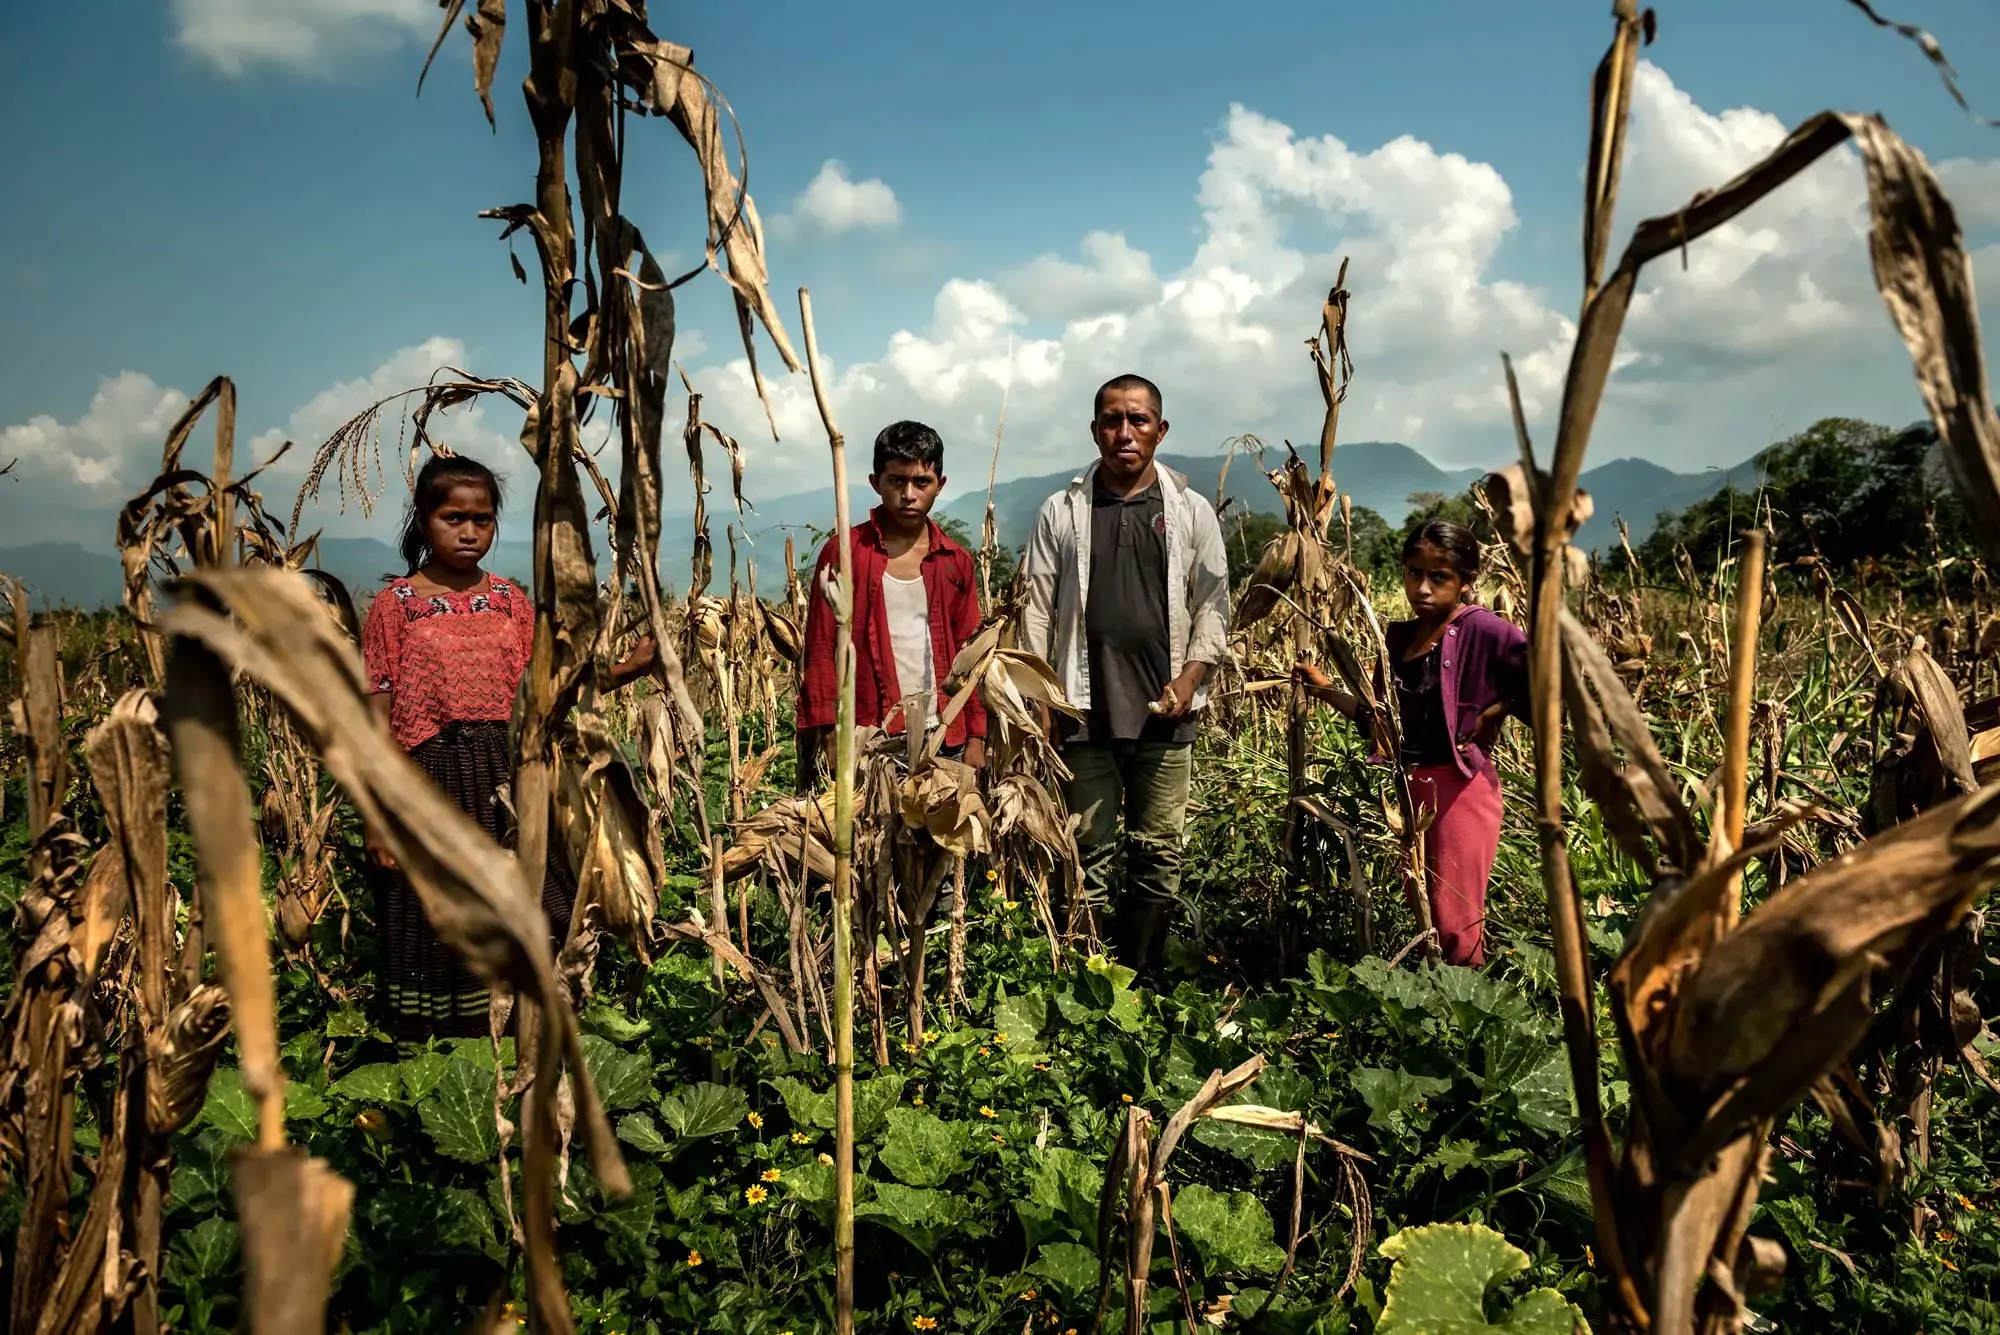
Image from the NYT The Great Climate Migration, 2020
It is important to remember that these visualisations all represent real people with different stories:
+ Pedro, a 62-year old man living in San Rafael Pie de la Cuesta, Guatemala, is able to sustain his life with his wife, from money that their kids send on a monthly basis.
+ Maria , a 21-year old single mother living in San Francisco Javier, El Salvador, receives her main source of income from a brother who works at Mcdonald’s in a neighboring city.
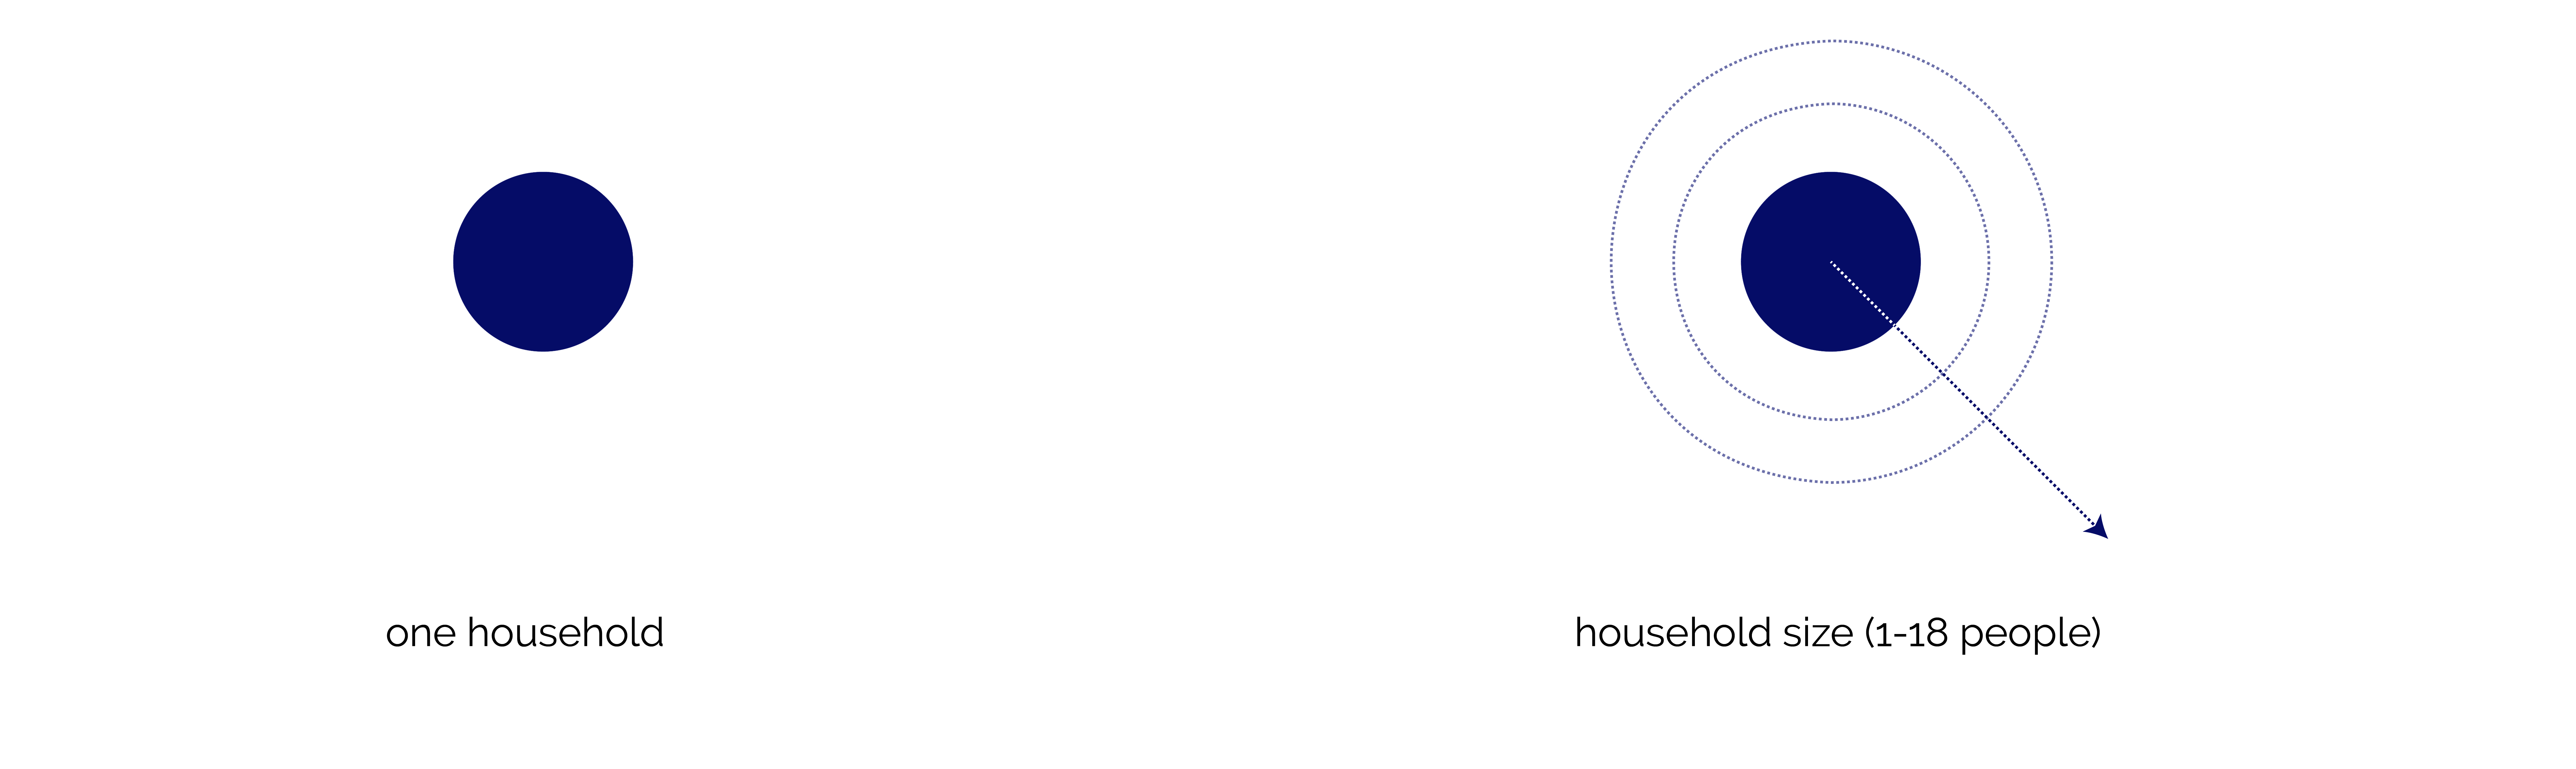
Takeaway 1: Larger Families have More Migration
Juan, a 23-year old in Isla de Mendez, El Salvador is part of an 18-person household wherein migration is a big part of their life. They have three family members who have migrated in the last five years. Looking into these households, we begin to see that as household size increases, the likelihood of migration within families also increases.
Household Size Across Families with or without Migrants (%)
Hover over the graph to explore the percentage of families with/without migrants across different household sizes!
Larger families have a higher likelihood of having migration, ranking higher in terms of total percent within all family sizes from 5-18 people. In contrast, smaller families are much less likely to have any member who has externally migrated in the last five years.
Takeaway 2: Families with Migrants have Higher Education
Carmen, A 27-year old bi-parental mother with six household members from Barrio Paz y Desarrollo, Guatemala, does not have anyone in her family who has migrated. However, in their survey, they emphasize the importance of education, urging her children to prioritize education and to return to study everyday.
Maximum Educational Level Achieved in Family, Across Families with or without Migrants (%)
Hover over the graph to explore the percentage of families with/without migrants across different educational levels!
Looking at the effects of migration, we can see that families with migrants tend to have a much higher maximum educational level achieved- 39.6% have a general/technical baccalaureate within their family, versus 33.1 percent for families without external migration. Does external migration lead to higher education? While correlation/causation cannot be deduced, it is clear that migration has a stabilizing force for education.
Takeaway 3: Families with Migrants have Higher Income Security
Ana, a 44-year old woman with a 10-person household living in El Salvador, relies on remittances from a daughter in Canada. It represents 50 percent of their monthly income, which is completed by 50 percent coming from their non-agricultural job. When it comes to families with migrants, migration can greatly improve income sufficiency.
Income Sufficiency Across Families with or without Migrants (%)
Hover over the graph to explore the percentage of families with/without migrants across different income sufficiency levels!
Families with migrants have a six percent higher likelihood of feeling income secure than families without migrants (measured as income sufficiency for 6 months), 20.1% vs. 13.1%. On the flipside, families without migrants have a slightly higher likelihood of suffering from income insufficiency, limiting families from being able to afford basic needs such as food, appliances, electricity bills. When looking at income security, one question is: what role do remittances play in obtaining this financial security?
Takeaway 4: Remittances Represent 20% of Primary Income for Families with Migrants
Remittances are a big part of the primary source of income- one-fifth of families with migrants say their primary source of income comes from migrant remittances from abroad. Even for households without any external migration, migrant remittances still make up five percent of primary source of income for these families. Does external migration lead to greater income sufficiency? While correlation/causation cannot be deduced, remittances are a major source of income for many households, and can help move families from insufficient to enough income.
Primary Source of Income Across Families with or without Migrants (%)
Hover over the graph to explore the primary source of income for different families!
Conclusion: Trickling Down Migration Benefits
In conclusion, Pedro, Maria, Juan, Carmen, and Ana are all individuals across the Northern Triangle that have been impacted by migration to varying degrees. By looking at the effects of migration through households as a collective unit, we begin to understand the prevalence and importance of migration for education and income. When thinking about policy, it is important to consider the households well beyond the singular, individual migrant. Migration affects entire households, and policy should be discussed in terms of the relation to their entire households.